
Absence of the MSMEG-3762/63 pump enhances membrane potential
To evaluate the functional role of MSMEG-3762/63 in membrane potential (Δψ), cytofluorimetric analysis was performed on M. smegmatis (wt), M. smegmatis (ΔMSMEG_3763) and M. smegmatis (ΔMSMEG_3763 pBD04) complemented strain, using the DiOC2 fluorescent carbocyanine dye. DiOC2 exhibits green fluorescence in the monomeric state but shifts toward red emission as the dye molecules form aggregates at high cytosolic concentrations caused by higher membrane potentials; the green–red shift disappears in the presence of the depolarizing compound CCCP. Comparative analysis of the three strains showed that ΔMSMEG_3763 had a greater membrane potential than the wt strain (Fig. 1), and that the wt phenotype was restored in the complemented strain. The higher membrane potential in the ΔMSMEG_3763 null mutant suggests that the pump may be involved in both drug and ion transport, as described for other ABC pumps24,25.
Comparative analysis of membrane potential. Comparison of the Δψ in M. smegmatis (wt), M. smegmatis (ΔMSMEG_3763) and complemented M. smegmatis (ΔMSMEG_3763 pBD04) (Compl.) was performed using the DiOC2 fluorescent dye and the ratiometric method (Red:Green). Data are the average of biological and technical triplicates in the absence and presence of the depolarizing compound CCCP. Error bars represent the standard deviation of the mean values. Significance of data obtained was tested by the Student’s t test (∗p < 0.05, compared to wt and Compl.).
Phenotypic analysis for drug-sensitivity in the M. smegmatis (∆MSMEG_3763) mutant strain
The increased efficacy of rifampicin and ciprofloxacin in null mutants of the MSMEG-3762/63 efflux pump was previously established21. To extend these findings to other first- and second-line anti-TB drugs, minimum inhibitory concentrations (MICs) were determined using the Resazurin Microtiter Assay (REMA). M. smegmatis mc2 155 (wt) and its isogenic deletion mutant (ΔMSMEG_3763) and complemented (ΔMSMEG_3763 pBD04) strains were grown to log phase and exposed to increasing concentrations of first-line (isoniazid, ethambutol, streptomycin) and second-line (levofloxacin, moxifloxacin, gatifloxacin) anti-TB drugs (Supplementary Table S2). In contrast to rifampicin and ciprofloxacin, no variations in MIC values of the null mutant compared to wt and complemented strains were detected, indicating that the MSMEG-3762/63 pump is not involved in the extrusion of these antibiotics. Therefore, we focused on the role of MSMEG-3762/63 in the efflux of rifampicin and ciprofloxacin.
The MSMEG_3762/63/65 operon is induced on exposure to sub-inhibitory antimicrobial drug concentrations
To investigate the possible role of rifampicin and ciprofloxacin as transcriptional inducers of the MSMEG_3762/63/65 operon, RT-qPCR analyses were performed on M. smegmatis wt cells exposed to sub-inhibitory concentrations (1/3rd MIC) of rifampicin (MIC = 3 μg mL−1) and ciprofloxacin (MIC = 0.25 μg mL−1). The expression of the operon increased 3.2-fold in the presence of rifampicin (Fig. 2a) and 2.8-fold in the presence of ciprofloxacin (Fig. 2b) compared to drug-free control bacilli. These data suggest that rifampicin and ciprofloxacin induce expression of this efflux pump system by binding the MSMEG-3765 TetR-like transcriptional regulator that controls expression of the efflux pump.
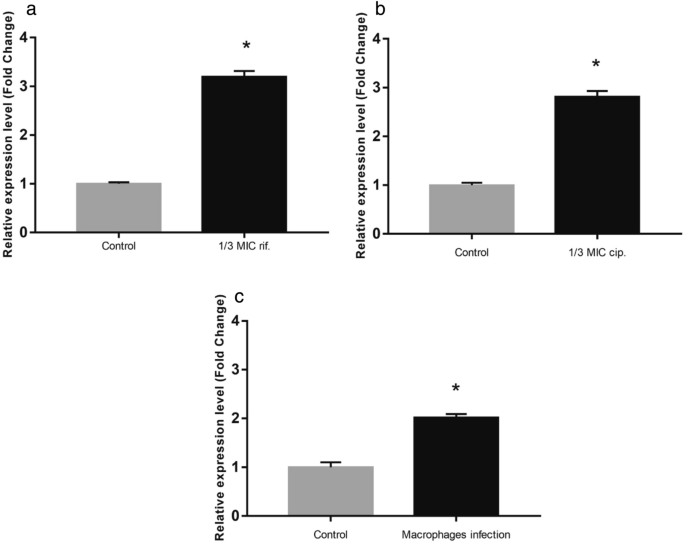
Transcriptional analysis in stress conditions. Comparative RT-qPCR analysis showing induction of the MSMEG_3762/63/65 operon in log phase culture after exposure to 1/3rd MIC rifampicin (a) and 1/3rd MIC ciprofloxacin (b) or after macrophage phagocytosis (c). Control in (a) and (b): cells grown in the absence of antibiotics; control in (c): cells grown in RPMI in the absence of macrophages. sigA was used as a reference gene and relative expression levels were calculated with the Pfaffl method (a,b) or the 2−ΔΔCt method (c). Data shown are the mean values of three independent experiments, and each RT-qPCR was carried out in technical triplicate. Error bars represent the standard deviation of the mean values. Significance of data obtained was tested by the Student’s t test (∗p < 0.05).
The efflux pump operon MSMEG_3762/63/65 is overexpressed in macrophages
In order to investigate the putative involvement of the efflux pump in the resistance to stress encountered within macrophage environment, the expression level of the efflux pump operon in macrophage was analysed. For this aim, human THP-1 monocytes were differentiated into macrophages and exposed to M. smegmatis (MOI 10:1). Phagocytosis was permitted for 2 h, after which the macrophages were lysed and RNA was extracted from the intracellular mycobacteria. The expression of the MSMEG_3762/63/65 operon was twofold higher compared to cells grown in RPMI alone (Fig. 2c). These results are consistent with the finding of Cossu and co-worker26. They reported that the mRNA profiles of M. tuberculosis and M. smegmatis exposed to acid-nitrosative stress, mimicking the macrophage environment, showed a high number of differentially expressed genes. In particular, the MSMEG_3762/63/65 operon was upregulated, and this observation was confirmed by GFP promoter probe analysis20. All together these data support the hypothesis that the MSMEG-3762/63 efflux pump, and likely homologous Rv1687/86c in M. tuberculosis, are involved in the adaptation of mycobacteria to intracellular environments.
Rifampicin and ciprofloxacin affect the binding activity of the TetR-like regulator
To further investigate the role of rifampicin and ciprofloxacin in the de-repression of the MSMEG_3762/63/65 operon, EMSA analyses were performed. The assay measured the binding of the MSMEG-3765 TetR recombinant protein to the cognate M. smegmatis 133 bp DNA fragment containing the operator site (36 bp palindromic motif)20 in the presence and absence of these antimicrobial drugs. The presence of increasing concentrations of rifampicin or ciprofloxacin (Fig. 3a and b, respectively) in the DNA/protein binding reaction mix resulted in an increase of the free unbound DNA fragment in respect to the control mix without drug. Streptomycin, which the null mutant ΔMSMEG_3763 was not hypersensitive to (unlike rifampicin and ciprofloxacin, Supplementary Table S2), was used as a negative control. As expected, the MSMEG-3765 binding to the TetR operator sequence was not affected by the presence of streptomycin (Fig. 3a, lanes 5 and 6). These data indicate that rifampicin or ciprofloxacin are able to directly interfear with the binding of the MSMEG-3765 TetR protein to its operator in the MSMEG_3762/63/65 operon, suggesting their role as specific ligands for this efflux pump repressor.
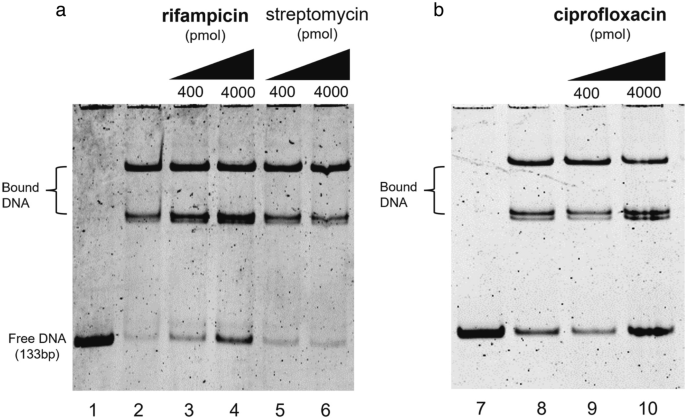
Drug interference in repressor/operator interactions. Binding of the TetR-like MSMEG-3765 to the MSMEG_3762/63/65 operator region is perturbed in the presence of rifampicin (a) or ciprofloxacin (b), but not streptomycin (a). Lanes 1 and 7: 133 bp DNA fragment containing the 36 bp palindromic motif upstream of MSMEG_3762. Lanes 2 and 8: DNA and purified MSMEG-3765, showing low abundance of free operator DNA in the presence of the regulator. In the other lanes, increasing concentrations (400 or 4000 pmol) of rifampicin (lanes 3 and 4) or ciprofloxacin (lanes 9 and 10) show an antimicrobial drug dose-dependent increase in free operator DNA, which does not occur after addition of streptomycin (lanes 5 and 6). The experiment was repeated 3 times.
The dimer of MSMEG-3765 exhibits the canonical structural architecture of TetR family transcriptional regulators
To understand the biological activities of the MSMEG-3765 repressor, description of its structural and dynamic features is essential, because the shape and nature of the protein surface play crucial roles in protein function. Therefore, we computationally predicted its three-dimensional structure using I-TASSER software (see “Materials and methods”, and Supplementary methods). The Ramachandran plot in Supplementary Fig. S1 reported over 97% residues in most favored and additional allowed regions demonstrating the good quality of the predicted 3D structure.
This latter was further validated, on the level of the secondary and quaternary structure organization, by using experimental Circular Dichroism (CD) data (Fig. S2) that were not used in the computational modelling. We compared the α-helix content estimated through the CD spectrum (Fig. S2A,B) with that obtained, as reported in the materials and methods, from the MSMEG-3765 homodimer model. As illustrated in Fig. S2B, the CD data indicate that the α-helix amount of the MSMEG-3765 is 60% which is in a good agreement with the secondary structure content calculated from the 3D structure (63%). Successively, we investigated the accuracy of the homodimer model in the description of the structural peculiarities of MSMEG-3765 by comparing the melting temperature (TM) estimated by CD thermal unfolding (Fig. S2C) and the acquired CD spectrum (S2 A,D,E) and with back-calculated data obtained from the MSMEG-3765 structures predicted for the monomeric and dimeric forms, respectivily. As reflected by the TM and RMSD values (Fig. S2C–E), the dimeric MSMEG-3765 model provides a better description of the experimental CD data than the monomeric form demostrating, together with the EMSA results, that the trascriptional regulator functions as dimer. The overall structural model of MSMEG-3765 is an Ω shaped-dimer (Fig. 4a) typical of a TetR family transcription regulator27,28. Each polypeptide chain (residues 2–211) of the MSMEG-3765 homodimer is folded into nine α-helices (α1-α9 for chain A; α1´-α9´ for chain B) with connecting turns and loops. The tertiary structure of the MSMEG-3765 monomer is mainly stabilized by hydrophobic helix-to-helix interactions. As for other members of the TetR family, the global structure of the MSMEG-3765 homodimer can be divided into two DNA-binding domains at the N-terminal tail (NTDs) of each monomer, and a regulatory core at the C-terminal domain (CTD) involved in dimerization and ligand binding. Each NTD is composed of helices α1 to α3 (α1 = Ser21—Arg37; α2 = Ile45—Ala50; α3 = Pro56—His60) (Fig. 4a and b) within which α2 and α3 constitute the classical helix-turn-helix (HTH) motif that is stabilized by the first α-helix (α1). Moreover, helix 1 is preceded by a positively charged region that, as observed for other TetR family members, may have a crucial role in the DNA recognition mechanism27. The regulatory domain is formed by helices α5 to α9 (residues α5 = Pro100—Ser109, α6 = Lys113—Ile122, α7 = Val128—Asp148, α8 = Gly154—Glu176, α9 = Val185—Gln197) and their symmetric helices α5´ to α9´ and it is connected to the NTDs through helices α4 and α4´. Helices α5 to α7 and their symmetric counterparts α5´ to α7´ form a central triangle subdomain; whereas α8 and α9 and their symmetric helices α8´ and α9´ make up a four-helix bundle that constitute the dimerization interface (Fig. 4a and b). Analysis of the electrostatic surface potential indicated that the NTDs are rich of positively charged residues; on the contrary, the core of the regulatory domain is negatively charged with several hydrophobic pockets (Fig. 4c). We then analyzed the conservation of the MSMEG-3765 dimer structure with the Consurf server using as a query the chain A of the predicted homodimer. As expected, the residues located in the HTH motifs of the NTDs were highly conserved (Supplementary Figs. S3, S4). In contrast, the residues situated at the outer surface surrounding the central triangle of the regulatory domain presented low conservation scores. Interestingly, the most conserved residues of the regulatory core domain belong mainly to helices forming the dimerization interface (α8, α9, α8´ and α9´), helices α5 to α7 and the dyad-related α5´ to α7´ that, as for other TetR regulators27, may play important roles in ligand recognition and modulation of MSMEG-3765 homodimer binding.

Structure and dynamics of the MSMEG-3765 homodimer. (a,b) The representative 3D structural model of the MSMEG-3765 transcriptional regulator obtained using the MSMEG-3765 primary sequence (https://zhanggroup.org/TACOS/) see “Materials and methods”). The helices 1 to 3 of NTD are depicted in dark violet, whereas helices 8 and 9 from each monomer forming a four-helical bundle that makes up the dimer interface are in light blue. (c) Electrostatic surface potential map of MSMEG-3765. The MSMEG dimer surface is depicted from electropositive (blue; 10 kcal/mol) to electronegative (red; − 10 kcal/mol). (d) Conformational ensemble of the MSMEG-3765 homodimer obtained using NMSim methodology. The two monomers are colored dark green (chain A) and orange (chain B). (e) Cα RMSFs (Root Mean Square Fluctuations) plotted versus the primary sequence for MSMEG-3765 chain A and B.
The MSMEG-3765 N-terminal DNA domains are more dynamic than the C-terminal regulatory core domain
In order to understand the relationship between structure, dynamics and function of the MSMEG-3765 homodimer, we investigated the dynamic personality of the dimer using Molecular Dynamics (MD) simulation methods (Fig. 4d and e). These techniques detail the motions and conformational changes of proteins and nucleic acids29. We first generated a conformational ensemble describing protein intrinsic motions for the MSMEG-3765 dimer (Fig. 4d); we then analyzed the per-residue RMSF (Root Mean Square Fluctuation) values calculated from the simulated MD ensemble (Fig. 4e). The RMSFs indicate that in each MSMEG-3765 monomer the N-terminal DNA-binding domains (NTD) (residues 1–65) and the C-terminal regulatory domain (CTD) (residues 85–211) are characterized by a different conformational mobility, with the NTDs showing a higher degree of flexibility than CTD (RMSFavgNTD = 7.17 ± 3.27 Å; RMSFavgCTD = 3.25 ± 0.70 Å) (Fig. 4e and Supplementary Table S3). In particular, in both NTDs the region preceding the first α-helix (residues 1–20) presents higher RMSFs than the helices α1, α2 and α3 demonstrating that the N-terminal tail is more flexible than the rest of the domain. Helix α4 and its symmetric counterpart α4´, showing a per-residue averaged RMSF of 2.95 ± 0.39 Å and 3.06 ± 0.45 Å, respectively, are connected to the CTD by two ten-residue relatively flexible loops. Helices α5 to α7 and their symmetric counterparts α5´ to α7´ present higher RMSF values than the helices involved in the dimerization interface, demonstrating that the four-helix bundle is more rigid than the central triangle subdomain.
MSMEG-3765/DNA recognition is regulated by interactions between the HTH motifs and the major groove
To explore the molecular determinants driving the DNA recognition mechanism of MSMEG-3765 homodimer, we performed a series of molecular docking studies. At the N-terminal region of each MSMEG-3765 monomer the DNA-binding domain (NTD) is composed mainly of the first three helices. According to this observation, the structural model of the MSMEG-3765 dimer/DNA complex shows that the core of each NTD is composed of helices α1- α3, with helix α3 responsible for the majority of DNA contacts (Fig. 5a and b). Helix α3 and the symmetric counterpart α3´ recognize mainly major grooves. Interestingly, the MSMEG-3765 dimer-DNA binding mechanism is mainly driven by phosphate backbone contacts with a significant contribution of base specific interactions in the complex stabilization. Indeed, because the operator sequence is partially palindromic the two NTDs (chain A = 1–65; chain B = 212–276) present a slightly different DNA binding interface producing a slight inclination (~ 15°) of the dimer with respect to the DNA long axis.

MSMEG-3765/DNA complex interactions. (a) Surface representation of the MSMEG-3765 homodimer in complex with DNA as reported by docking studies. Monomer A and B are colored dark green and orange, respectively; the DNA is depicted in light grey. Close-up views of side chain-DNA interactions for the NTD residues involved in the complex formation are detailed. (b) A schematic drawing of MSMEG-3765/DNA interactions. Only direct contacts between the protein and the nucleic acid are shown. Hydrogen bond (HB) and hydrophobic interactions (Hpho) are reported. Hydrophobic interactions were determined using a threshold distance of 4.5 Å.
In particular, in monomer A, Asn38, Lys42 and Ser44 contact the phosphate backbone of C24, G25 and G26; in helix α2 Arg46 forms hydrogen bonds with the phosphate backbone of G27, C28, C8´and G9´ (symbol (´) indicates the anti-parallel operator strand) whereas Ala50 participates in DNA-binding by making hydrophobic contacts with C8´; Ala57, located within the recognition helix α3, is involved in hydrophobic base specific interactions fundamental for the DNA binding mechanism. In addition, Asp53, Val54 and Asp55 residues, located inside the turn of the HTH motif of the NTD monomer A, contribute to stabilization of the MSMEG-3765 dimer/DNA complex. For monomer B, in helix α3 Ala57´ and Leu58´ are involved in hydrophobic interactions with A17, C18 and T19 whereas His60´ is hydrogen-bonded with the phosphate backbone of A17´, A18´ and G19’; Ile45´ and Arg46´ of helix α3 form hydrophobic and hydrogen bond interactions with G16´of the anti-parallel DNA strand. Moreover, other interactions between the monomer B and the DNA are hydrogen bonds involving several residues located in the turn of the HTH motif and amino acids situated at the edge of helix α4. Notably, different to chain A, the DNA-binding of monomer B is further stabilized by a positively charged region preceding the first helix of the NTD. In particular, the side chain of Arg9 is deeply buried in the minor groove, forming hydrogen bonds with the phosphate backbone of T15, and G16, C24´ and A25´ (Fig. 5b).
Rifampicin and ciprofloxacin bind the MSMEG-3765 repressor at different binding sites
To uncover how rifampicin and ciprofloxacin might interact with the TetR-like regulator to abrogate DNA binding, we integrated these antibiotics into our molecular docking models of MSMEG-3765. The 3D structural model of MSMEG-3765 homodimer/rifampicin indicates that the ligand-binding surface of the homodimer is composed of residues from both monomers located within the C-terminal regulatory domain (CTD). Rifampicin binds into a hydrophobic groove of the protein with specific contacts to helices of the central triangle subdomain (α5–α7) and the helix α8 (Fig. 6a). In detail, the binding of rifampicin is principally driven by an extensive network of hydrophobic interactions involving: Leu103 and Trp107 located in the middle of the α5; Gln136, Ile139 and Val140 encompassing the helix α7; Ala162, Leu165, Val166 and Val169 situated within the helix α8; Leu175 and Phe180 located in the helix α8´ of the other monomer (chain B). Additionally, the interaction of rifampicin with MSMEG-3765 is further stabilized by a series of hydrogen bonds between the ligand and different MSMEG-3765 residues: Arg120 at the C-terminal edge of the helix α6; Arg132 and Gln135 located inside the helix α7; and Ala162, Val166 of the helix α8 (Fig. 6b and c). In the case of ciprofloxacin, the structure of the MSMEG-3765 homodimer/ciprofloxacin complex shows that the ligand is accommodated into a shallow hydrophobic pocket on the protein surface formed mainly by Leu135 of the helix α7 and by two residues of the helix α8 (Ala162 and Val166).

Interactions of the MSMEG-3765 homodimer with rifampicin and ciprofloxacin as revealed by molecular docking. (a) Ribbon drawing representation of the MSMEG-3765 dimer/rifampicin complex, where the ligand surface is highlighted as light blue and the regions of the transcription regulator are depicted in light green. (b) A 2D interaction map of rifampicin in complex with the MSMEG-3765 dimer identifying key interaction sites. (c) The rifampicin binding pocket in chain A of the MSMEG-3765 dimer. The side chains of the MSMEG-3765 residues involved in hydrogen bonds are illustrated as light green, whereas the ligand is colored light blue. The side chains of the residues making hydrophobic interactions are not shown. (d) The ciprofloxacin-binding site in chain A of MSMEG-3765. The ligand is reported in magenta, whereas the residues involved in the interactions are colored gold. The surface of the ligand is also shown. (e) A 2D interaction map of ciprofloxacin in complex with the MSMEG-3765 dimer. (f) Detailed view of the MSMEG-3765/ciprofloxacin complex. The ligand and side chains of the residues involved in the formation of the complex are depicted in magenta and gold, respectively.
Moreover, the guanidinium of Arg132 (α7) hydrogen binds with both carboxyl oxygens of ciprofloxacin (Fig. 6d–f). These latter interactions play an important role in the stabilization of the MSMEG-3765 homodimer/ciprofloxacin complex. Notably, comparison of the structural models obtained for rifampicin and ciprofloxacin clearly shows that the two antibiotics bind the MSMEG-3765 CTD at distinct binding sites suggesting that the two drugs likely present different structural mechanisms that mediate operon de-repression. To provide structural insight into the potential molecular mechanisms of efflux pump operon de-repression mediated by rifampicin and ciprofloxacin, we analyzed the 3D models of MSMEG-3765 in complex with either drug using the structural data available for other TetR family members27. This conformation analysis indicated that, upon ligand binding to CTD, de-repression of the operon likely occurs through conformational changes that abolish the ability of the homodimer to recognize the operator sequence by increasing the separation between NTDs of the two monomers.

Shambhu Kumar is a science communicator, making complex scientific topics accessible to all. His articles explore breakthroughs in various scientific disciplines, from space exploration to cutting-edge research.
