Influenza vaccines and vaccine viruses used during the 2018−2019 and 2019−2020 study seasons
This study was a randomized, open-label trial conducted in the United States during the Northern Hemisphere 2018−2019 (Year 1, n = 723) and 2019−2020 (Year 2, n = 684) influenza seasons (Fig. 1). In year 1, HCP were randomized to receive one of four influenza vaccines: ccIIV4 (Flucelvax), RIV4 (Flublok), Fluzone IIV4 or Fluarix IIV4. Year 1 vaccines contain 2018−2019 Northern Hemisphere formulation including an A/Michigan/45/2015 (H1N1)pdm09-like virus; an A/Singapore/INFIMH-16-0019/2016 (H3N2)-like virus; a B/Colorado/06/2017-like virus (B/Victoria/2/87 lineage); and a B/Phuket/3073/2013-like virus (B/Yamagata/16/88 lineage) (Table 1). ccIIV4 in the 2018−2019 season contained cell-culture derived seed strains for the influenza A(H3N2) and B vaccine strains but egg-based seed strain for A(H1N1)pdm09. In year 2 (2019−2020 season), HCP were re-randomized into 7 repeat vaccination arms: IIV4-IIV4, IIV4-ccIIV4, IIV4-RIV4, RIV4-ccIIV4, RIV4-RIV4, ccIIV4-ccIIV4 and ccIIV4-RIV4 (Fig. 1). The A(H1N1)pdm09 and A(H3N2) components were updated to a A/Brisbane/02/2018 (H1N1)pdm09-like virus and an A/Kansas/14/2017 (H3N2)-like virus respectively while the B/Victoria and B/Yamagata components remained the same (Table 1).
Abbreviations: IIV4: Inactivated influenza vaccine (Fluzone® or Fluarix® Quadrivalent); ccIIV4: Cell-culture based IIV (Flucelvax® Quadrivalent); RIV4: recombinant-hemagglutinin influenza vaccine (Flublok® Quadrivalent). *Numbers in parenthesis are new enrollees for Year 2.
Egg-adapted amino acid substitutions in egg-based vaccines in both study years
HA sequences from components of IIV4, ccIV4 and RIV4 vaccines used in both study years were first analyzed (Table 1). Within the same season, the study vaccines contained different candidate vaccine viruses (CVVs) that are antigenically-like the prototype vaccine viruses recommended by the World Health Organization (WHO)30. Compared to the cell-grown vaccine prototype viruses, the vaccine antigens from all 4 subtypes in the egg-based vaccines had HA substitutions due to egg-adaptation. A(H1N1)pdm09 egg CVV formulated in Fluzone IIV4 had Q223R substitution in both years, while the egg CVV used for Fluarix IIV4 and ccIIV4 in year 1 had G225A substitution instead (Table 1). For A(H3N2), year 1 egg-based vaccine had T160K (resulting in a loss of glycosylation motif at HA 158), L194P, and D225G egg-adapted changes, while year 2 egg-based vaccine had D190N and N246T substitutions. Influenza B vaccine viruses remained the same in both years. Egg-based B/Victoria vaccine had T199I substitution, which can cause a loss of glycosylation motif at HA position 197; whereas egg-based B/Yamagata vaccine had a N197D substitution that can also cause a loss of glycosylation motif at HA position 197.
Antibody responses at pre-vaccination, 1-month and 6-months post-vaccination in Year 1
We first measured neutralizing antibody responses by microneutralization assays (MN) for A(H3N2) and hemagglutination inhibition assays (HI) for A(H1N1)dpm09 and Bs. In year 1 at baseline, pre-vaccination MN/HI geometric mean titers (GMTs) were similar (p > 0.05) among the 4 vaccine groups (Fig. 2). Significant differences in neutralizing antibody responses were detected at 1-month post-vaccination. For A(H3N2), RIV4 vaccination induced significantly higher (p < 0.05) neutralizing antibody responses to the cell-propagated A(H3N2) virus than ccIIV4 and IIV4s (Fluarix and Fluzone) in both age groups; RIV4 group also mounted significantly higher (p < 0.05) MN antibody responses to the egg-propagated A(H3N2) virus than ccIIV4 and Fluarix-IIV4. For A(H1N1)pdm09, RIV4 induced significantly higher (p < 0.05) post-vaccination HI antibody responses to both egg- (GMT 122) and cell- (GMT 137) propagated A(H1N1)pdm09 viruses than ccIIV4 (egg virus GMT 76; cell virus GMT 77) in the 18-44 years age group, and significantly higher (p < 0.05) post-vaccination HI antibodies to egg- (GMT 82) and cell- (GMT 76) propagated A(H1N1)pdm09 viruses than Fluzone-IIV4 (egg virus GMT 43; cell virus GMT 36) in the 45-64 years age group. In contrast, post-vaccination HI antibodies to B/Victoria and B/Yamagata viruses were mostly similar (p > 0.05) among the 4 vaccines in both age groups, except that RIV4 induced significantly higher (p < 0.05) HI antibody responses (GMT: 117) to cell-propagated B/Yamagata vaccine virus than ccIIV4 (GMT: 80) in the 18−44 years age group (Fig. 2). RIV4 also had higher seropositivity rate (proportions of titers ≥40) and seroconversion rate (SCR) than egg-based IIV4 vaccines against the cell-grown A(H3N2) virus (Supplementary Tables S1 and S2)27.
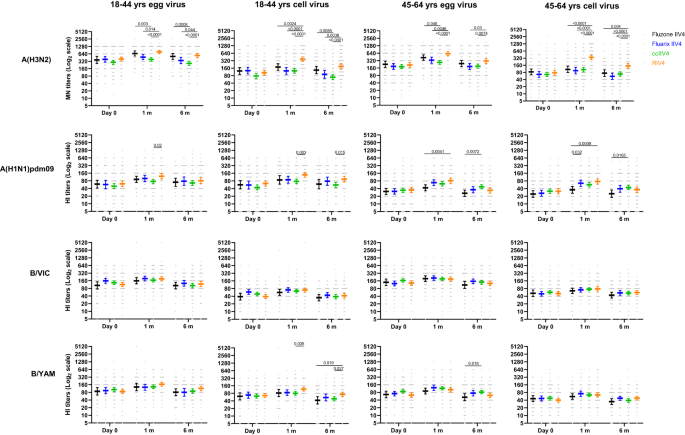
Antibody titers from each of the four vaccine groups were presented as geometric mean titers (GMTs) with 95% confidence interval (CI) respectively for 18−44 years and 45−64 years age groups. Gray dots represented individual titers. Fluzone IIV4 18−44 years: Day 0 (n = 52), 1 m (n = 52), 6 m (n = 47); Fluzone IIV4 45-64 years: Day 0 (n = 58), 1 m (n = 58), 6 m (n = 54); Fluarix IIV4 18−44 years: Day 0 (n = 55), 1 m (n = 55), 6 m (n = 48); Fluarix IIV4 45−64 years: Day 0 (n = 65), 1 m (n = 63), 6 m (n = 59); ccIIV4 18−44 years: Day 0 (n = 135), 1 m (n = 133), 6 m (n = 124); ccIIV4 45−64 years: Day 0 (n = 148), 1 m (n = 147), 6 m (n = 142); RIV4 18−44 years: Day 0 (n = 99), 1 m (n = 98), 6 m (n = 85); RIV4 45−64 years: Day 0 (n = 98), 1 m (n = 98), 6 m (n = 92); Microneutralization titers (MN) were measured for A(H3N2) virus, while hemagglutination inhibition (HI) titers were measured for A(H1N1)pdm09, B/Victoria (B/VIC), and B/Yamagata (B/YAM) viruses. One-way ANOVA corrected for multiple comparisons (Tukey’s test) was used to compare the GMTs of each time point among the 4 vaccine groups. Statistically significant differences between groups are indicated by p values on the horizontal bars.
When comparing post-vaccination antibody responses by fold rise, RIV4 induced overall higher geometric mean fold rise of neutralizing antibody titers to the vaccine viruses (Fig. 3A, B). For A(H3N2), RIV4 induced higher fold rise of neutralizing antibodies to both cell- and egg-propagated A(H3N2) viruses compared to other vaccines in both age groups (Fig. 3A, B). MN fold rise to A(H3N2) cell vaccine virus was significantly higher (p < 0.0001) in RIV4 groups (3.5 in 18−44 years, 4.6 in 45−64 years) than those in IIV4 and ccIIV4 groups (range: 1.0−1.6). Neutralizing antibody responses waned at 6-months post-vaccination in year 1. GMTs to each virus at 6-months reduced by 1−2.5 folds comparing with the GMTs at 1-month post-vaccination (Fig. 3C, D). At 6-months post-vaccination, although fold reduction in neutralizing antibodies (6 month/1 month) was greater in RIV4 recipients to cell-A(H3N2) in both age groups, and to cell-A(H1N1)pdm09 virus in the 45−64 years group (Fig. 3C, D), the titers of neutralizing antibodies to cell-grown viruses in RIV4 recipients still remained at similar or higher levels compared to other vaccine groups (Fig. 2).
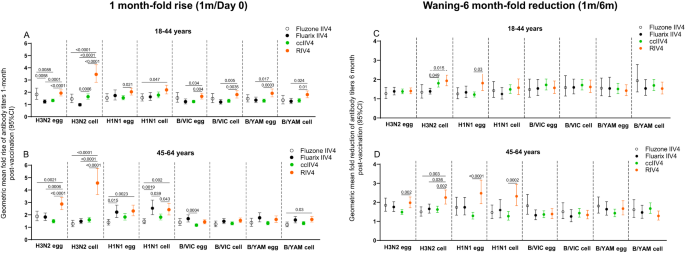
Geometric mean (GM) fold rise of antibody titers (1 m/Day 0) from each of the four vaccine groups were calculated for egg- and cell-propagated vaccine viruses, and for 18−44 years (Fluzone IIV4 (n = 52), Fluarix IIV4 (n = 55), ccIIV4 (n = 133), RIV4 (n = 98)) and 45−64 years (Fluzone IIV4 (n = 58), Fluarix IIV4 (n = 63), ccIIV4 (n = 147), RIV4 (n = 98)) age groups respectively (A, B). Antibody waning was expressed as the GM fold-reduction of titers from 1-month to 6-months (1 m/6 m) post-vaccination for 18−44 years (Fluzone IIV4 (n = 47), Fluarix IIV4 (n = 48), ccIIV4 (n = 124), RIV4 (n = 85)) and 45−64 years (Fluzone IIV4 (n = 54), Fluarix IIV4 (n = 59), ccIIV4 (n = 142), RIV4 (n = 92)) respectively (C, D). MN titers were measured for A(H3N2) virus, while HI titers were measured for A(H1N1)pdm09, B/VIC, and B/YAM viruses. One-way ANOVA corrected for multiple comparisons (Tukey’s test) was used to compare the GM fold-rise or fold-reduction of each time point among the 4 vaccine groups. Statistically significant differences between groups are indicated by p values on the horizontal bars.
To further elucidate the quality of the antibody responses, we then analyzed the total binding antibodies by the enzyme linked immunosorbent assay (ELISA) to both HA head of the 4 antigen subtypes and HA stalk of the A(H3N2) and A(H1N1)pdm09 subtypes in the quadrivalent vaccines. Total binding antibodies include both neutralizing and non-neutralizing antibody responses. For A(H3N2), consistent with MN responses, RIV4 induced significantly higher (p < 0.01) total binding antibodies (Fig. 4A) and significantly higher (p < 0.001) fold rise (Fig. S1A) to the cell-A(H3N2) HA head at 1-month post-vaccination compared to IIV4 and ccIIV4. For A(H1N1)pdm09, all 4 vaccines induced similar fold rise (1 month/day 0) in the total binding antibodies to egg- and cell- A(H1N1)pdm09 HA (Fig. S1A), although RIV4 group had the highest total binding antibodies to the cell-A(H1N1)pdm09 HA at 1-month post-vaccination, it is likely due to the higher levels of pre-vaccination total binding antibodies (Fig. 4A). For influenza Bs, RIV4 induced significantly higher (p < 0.01) fold-rise against B/VIC and B/YAM cell virus HA head than Fluarix IIV4 but not Fluzone IIV4 (Fig. S1A). At 6-months post-vaccination, total binding antibodies to the HA head waned but the levels of total binding antibodies to the cell-grown virus HA head of all 4 subtypes in the RIV4 group remained the highest among the 4 vaccine groups (Fig. 4A).
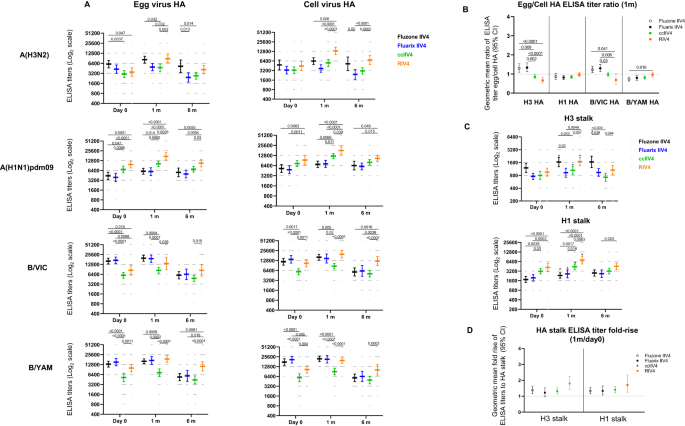
Antibody titers from each of the four vaccine groups were presented as geometric mean titers (GMTs) with 95% confidence interval (CI) for combined 18−44 years and 45−64 years age groups. Gray dots represented individual titers. Fluzone IIV4: Day 0 (n = 24), 1 m (n = 24), 6 m (n = 21); Fluarix IIV4: Day 0 (n = 24), 1 m (n = 24), 6 m (n = 23); ccIIV4: Day 0 (n = 56), 1 m (n = 54), 6 m (n = 51); RIV4: Day 0 (n = 40), 1 m (n = 40), 6 m (n = 38). A: HA (A(H1N1)pdm09) or HA head (A(H3N2), B/VIC, B/YAM) binding antibodies. B: Ratios of egg/cell HA or HA head binding antibody titers with 95% CI. C: H3 stalk and H1 stalk antibody responses at day 0, 1-month and 6-months post vaccination. D: Fold rise of H3 stalk and H1 stalk antibody titers from pre to 1-month post-vaccination with 95% CI. One-way ANOVA corrected for multiple comparisons (Tukey’s test) was used to compare the GMTs of each time point among the 4 vaccine groups (A, C). One-way ANOVA nonparametric Kruskal-Wallis test was used to compare the fold changes among the 4 vaccine groups (B, D). Statistically significant differences between groups are indicated by p values on the horizontal bars.*: In (C), paired t test (two-tailed) was used for comparing the pre- and 1 m post-vaccination stalk antibody titers within the same vaccine group: significantly higher HA stalk antibody titers were detected in 1 m post-vaccination than pre-vaccination for H3 stalk binding antibody in Fluzone IIV4 (p = 0.0009), ccIIV4 (p = 0.0004), RIV4 (p < 0.0001); and for H1 stalk binding antibody in Fluzone IIV4 (p = 0.0005), Fluarix IIV4 (p = 0.0092), ccIIV4 (p < 0.0001), RIV4 (p = 0.0015).
Pre-existing A(H3N2) and A(H1N1)pdm09 HA stalk antibodies were detected in participants at varies levels. Comparing HA stalk antibody titers at 1-month post-vaccination versus day 0, vaccination significantly boosted A(H1N1)pdm09 HA stalk antibodies in all 4 vaccine groups (p < 0.01), and significantly boosted A(H3N2) HA stalk antibodies in 3 of the 4 vaccine groups (p < 0.001, Fluzone IIV4, ccIIV4, and RIV4) (Fig. 4C). The RIV4 group had the highest A(H1N1)pdm09 HA stalk and A(H3N2) HA stalk antibodies at 1-month post-vaccination, however the fold rises of HA stalk antibodies were low (<1.8) and similar among all 4 vaccine groups (Fig. 4D). At 6-months post-vaccination, waning of HA stalk antibodies were more notable in ccIIV4 and RIV4 groups compared to IIV4 (Fig. S2).
Active surveillance was conducted during the influenza season in year 1, a total of 26 breakthrough infection cases were identified with an attack rate of 3.6% (26/723) (Supplementary Table S3).
Antibody responses to egg-adapted epitopes measured by antibody GMT egg/cell titer ratio in year 1
To assess the levels of antibody responses targeting the egg-adapted epitopes, we used the antibody “GMT egg/cell titer ratio” as a proxy to quantify the extent of difference in antibody responses to egg- versus cell-viruses in each vaccine group (Fig. 5A, B). The post-vaccination neutralizing antibody GMT egg/cell titer ratio was the most pronounced for A(H3N2), with elevated MN GMT egg/cell titer ratios in all vaccine groups (Fig. 5A, B), suggesting vaccination induced significant levels of neutralizing antibody responses targeting A(H3N2) egg-adapted epitopes related to 158 (CHO-), 194 P, and 225 G (Table 1). The post-vaccination A(H3N2) neutralizing antibody GMT egg/cell ratio from the 18−44 years group who received Fluzone IIV4 (3.7), Fluarix IIV4 (3.8), and ccIIV4 (3.0) were significantly higher (p < 0.05) than those in the same age groups who received RIV4 (2.1) (Fig. 5A). Similar trend was also observed in the 45−64 years group, the post-vaccination A(H3N2) neutralizing antibody GMT egg/cell titer ratios in those who received Fluzone IIV4 (4.0), Fluarix IIV4 (3.5), and ccIIV4 (2.6) were significantly higher (p < 0.01) than those who received RIV4 (1.7) (Fig. 5B).
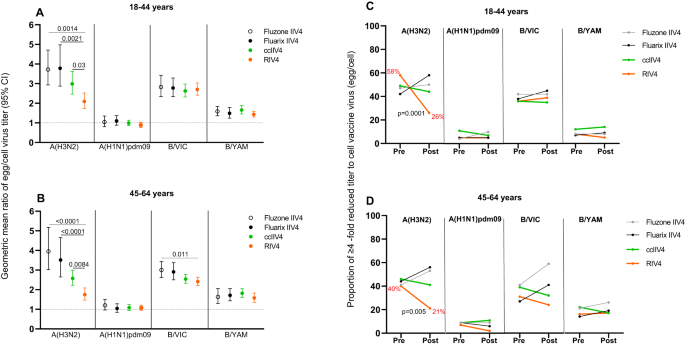
A, B: Geometric mean ratio of egg/cell virus titers at 1-month post-vaccination with 95% CI for each vaccine component among the 4 vaccine groups for 18-44 years (A Fluzone IIV4: n = 52, Fluarix IIV4: n = 55, ccIIV4: n = 133, RIV4: n = 98) and 45−64 years (B Fluzone IIV4: n = 58, Fluarix IIV4: n = 63, ccIIV4: n = 147, RIV4: n = 98) age groups. One-way ANOVA nonparametric Kruskal-Wallis test was used for comparison of geometric mean ratio of egg/cell virus titers among the 4 vaccine groups. C, D: Proportion of participants with GMT egg/cell ratio ≥4 fold pre- and 1-month post-vaccination in each vaccine group. Proportions of participants who had ≥4 -fold reduced titer to cell vaccine virus (egg/cell titer ratio) at pre- and 1-month post-vaccination were presented for each vaccine component among the 4 vaccine groups for 18−44 years (C) and 45−64 years (D). Fisher’s exact test (two-tailed) was performed for comparing proportions of ≥4 -fold reduced titer to cell vaccine virus between pre- and 1-month post-vaccination in each vaccine group. MN titers were measured for A(H3N2) virus, while HI titers were measured for A(H1N1)pdm09, B/VIC, and B/YAM viruses. Statistically significant differences between groups are indicated by p values on the horizontal bars (A, B). P values on the trend lines of RIV4 group indicate significantly reduced proportions from pre- to 1-month post-vaccination (C, D).
In contrast, the impact of egg-adaption is less profound in HI antibody responses to A(H1N1)pdm09 and both B lineage viruses. For A(H1N1)pdm09 and B/Yamagata, the post-vaccination HI antibody GMT egg/cell titer ratios were all <2 and similar (p > 0.05) among the vaccine groups (Fig. 5A, B). For B/Victoria, the post-vaccination HI GMT egg/cell titer ratios were slightly elevated (range: 2−3) with the ratio in Fluzone IIV4 recipients significantly higher (p < 0.05) than those in RIV4 recipients from the 45−64 years group (Fig. 5B).
Next, to assess whether vaccination with non-egg-based vaccines can overcome the impact of egg-adaptation and reduce the GMT egg/cell ratio in the vaccine responses, we calculated the “proportion of the participants with egg/cell ratio ≥4” in MN/HI titers at pre- and 1-month post-vaccination (Fig. 5C, D). At pre-vaccination, there was no significant difference in the proportion of participants with GMT egg/cell ratio ≥4 among the 4 vaccine groups. At baseline, around 40% of participants had GMT egg/cell ratio ≥4 to A(H3N2) and B/Victoria viruses, suggesting a high prevalence of pre-existing neutralizing antibodies targeting HA egg-adapted epitopes in this highly vaccinated HCP population. After vaccination, in both age groups, the two egg-based vaccines generally reinforced the neutralizing antibody responses to egg-adapted epitopes as evidenced by an increased trend in the proportion of participants with GMT egg/cell titer ratio ≥4. In contrast, among RIV4 and ccIIV4 recipients, the proportion of participants with GMT egg/cell titer ratio ≥4 was overall lower at 1-month post-vaccination compared to pre-vaccination (Fig. 5C, D), demonstrating the potential of non-egg-based vaccines to reduce the neutralizing antibody response difference to egg versus cell viruses. Most notably, only in the RIV4 groups to A(H3N2) virus, the proportions of GMT egg/cell titer ratio ≥4-fold were significantly (p < 0.01) decreased in both age groups (from 58% down to 26% in 18−44 years, and from 40% down to 21% in 45−64 years), suggesting RIV4 vaccination can potentially mitigate the pre-existing antibody memory to egg-adapted epitopes by improving the magnitude of neutralizing antibody responses to cell-propagated viruses (Fig. 5C, D).
We then also analyzed the HA binding antibody “GMT egg/cell titer ratio” measured by ELISA. Similar trend was observed as with MN/HI antibodies that GMT egg/cell ratios were higher (p < 0.05) in the egg-based IIV4 groups than those in the ccIIV4 and RIV4 groups for A(H3N2) HA head and B/VIC HA head binding antibodies (Fig. 4B). However, the GMT egg/cell HA binding antibody ratios (Fig. 4B) were around 1 for all vaccine groups and subtypes, even for A(H3N2), suggesting that unlike the neutralizing antibody responses, most total binding antibody responses do not target the egg-adapted epitopes on HA.
Redirecting neutralizing antibody responses from egg-adapted epitopes following repeat vaccination with non-egg vs egg-based vaccines in year 2
In year 2, participants who received ccIIV4, RIV4, and Fluzone IIV4 or Fluarix IIV4 in year 1 were re-randomized into seven repeat-vaccination arms: ccIIV4-ccIIV4, ccIIV4-RIV4, RIV4-ccIIV4, RIV4-RIV4, IIV4-ccIIV4, IIV4-RIV4, IIV4-IIV4 (Fluzone) (Fig. 1).
We compared the post-vaccination HI GMTs to the cell-vaccine viruses between IIV4-IIV4 (Fluzone) and each of the 6 repeat vaccination arms with non-egg-based vaccines (Fig. 6). Participants in younger age group (18−44 years) in the ccIIV4-RIV4, RIV4-ccIIV4, RIV4-RIV4, and IIV4-RIV4 arms, and the older age group (45−64 years) in ccIIV4-RIV4 and RIV4-RIV4 arms, all mounted significantly higher (p < 0.05) neutralizing antibody titers to cell-A(H3N2) virus than those in the IIV4-IIV4 (Fluzone) arm. For HI antibody response to A(H1N1)pdm09 cell virus, RIV4-RIV4 and IIV4-RIV4 arms in 18−44 years, ccIIV4-RIV4, RIV4-ccIIV4, RIV4-RIV4 arms in 45−64 years all had significantly higher (p < 0.05) HI antibody responses than those in the IIV4-IIV4 (Fluzone) arm. Vaccinees in the 18−44 years group in the ccIIV4-RIV4, RIV4-RIV4, and IIV4-RIV4 arms had significantly higher (p < 0.05) HI antibody responses to both B/VIC and B/YAM cell viruses versus those in the IIV4-IIV4 (Fluzone) arm. Participants in the older age group (45−64 years) who received non-egg-based vaccine in year 2, most had significantly higher (p < 0.05) HI GMTs to both B/VIC and B/YAM cell virus compared to those in the IIV4-IIV4 (Fluzone) arm, except ccIIV4-ccIIV4 and IIV4-ccIIV4 arms for B/YAM cell virus (Fig. 6). It is worth noting that those who received IIV4 in Year 1 then RIV4 in Year 2 demonstrated improved antibody responses to cell-grown vaccine viruses compared to those who received IIV4-IIV4 (Fluzone). The seropositivity rates (Supplementary Table S4) and seroconversion rates (Table S5) to both egg- and cell- viruses in year 2 are summarized in the supplementary materials28,29. Overall, in year 2 participants who received one or two non-egg-based vaccines mounted higher post-vaccination HI antibody responses to cell-grown vaccine viruses than those who received repeated egg-based IIV4 vaccination in both years (IIV4-IIV4).
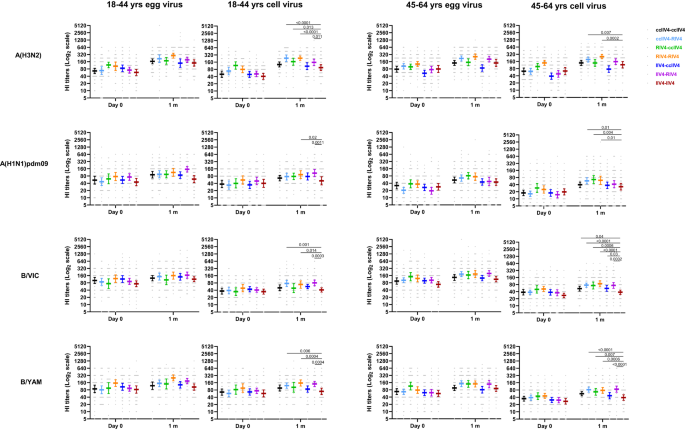
HI antibody titers from each of the 7 repeat vaccine arms were presented as geometric mean titers (GMTs) with 95% confidence interval (CI) respectively for 18−44 years and 45−64 years age groups. Gray dots represented individual titers. 18−44 years: ccIIV4-ccIIV4 (n = 42), ccIIV4-RIV4 (n = 45), RIV4-ccIIV4 (n = 28), RIV4-RIV4 (n = 30), IIV4-ccIIV4 (n = 49), IIV4-RIV4 (n = 48), IIV4-IIV4 (n = 47). 45−64 years: ccIIV4-ccIIV4 (n = 59), ccIIV4-RIV4 (n = 61), RIV4-ccIIV4 (n = 45), RIV4-RIV4 (n = 44), IIV4-ccIIV4 (n = 57), IIV4-RIV4 (n = 56), IIV4-IIV4 (n = 56). Unpaired t test (two-tailed) was used to compare the post-vaccination GMTs to cell vaccine viruses between IIV4-IIV4 (Fluzone) arm and each of the remaining 6 vaccine arms within the same age group. Statistically significant differences between groups are indicated by p values on the horizontal bars.
At 1-month post-vaccination during Year 1, 21−40% of HCP who received only one season of non-egg-based vaccine including RIV4 still had A(H3N2) GMT egg/cell titer ratio ≥4 (Fig. 5C, D). We therefore investigated whether repeat vaccination with non-egg-based vaccines in year 2 could further reduce the HI GMT egg/cell titer ratio (Fig. 7). Among recipients of IIV4-IIV4 (Fluzone), the proportion of participants with HI GMT egg/cell titer ratio ≥4 generally increased, especially for A(H3N2) and B/VIC in the 18−44 years group, B/VIC virus and B/YAM virus in the 45−64 years group, suggesting repeated boost to antibodies targeting egg-adapted epitopes in these participants after receiving consecutive egg-based IIV4 vaccination. In contrast, among recipients of non-egg-based vaccines in just one study year (IIV4-ccIIV4 or IIV4-RIV4) or in both study years (ccIIV4-ccIIV4, ccIIV4-RIV4, RIV4-ccIIV4, RIV4-RIV4), the proportions of participants with egg/cell ratio ≥4 to generally decreased post-vaccination though did not reach statistical significance in some repeat vaccination groups (Fig. 7). Among those, the ccIIV4-RIV4 arm had significant (p < 0.05) reduction in the proportion of HI GMT egg/cell ratio ≥4 against A(H3N2) viruses comparing pre- vs post-vaccination in the 45−64 years group, and the RIV4-ccIIV4 arm had significant (p < 0.05) reduction in the proportion of HI GMT egg/cell ratio ≥4 against A(H1N1)pdm09 virus in the younger age group in year 2, suggesting multiple seasons of repeat vaccination with non-egg-based vaccines may be needed to overcome the dominant antibody responses to the egg-adapted epitopes and redirect the antibody responses away from the egg-adapted epitopes.
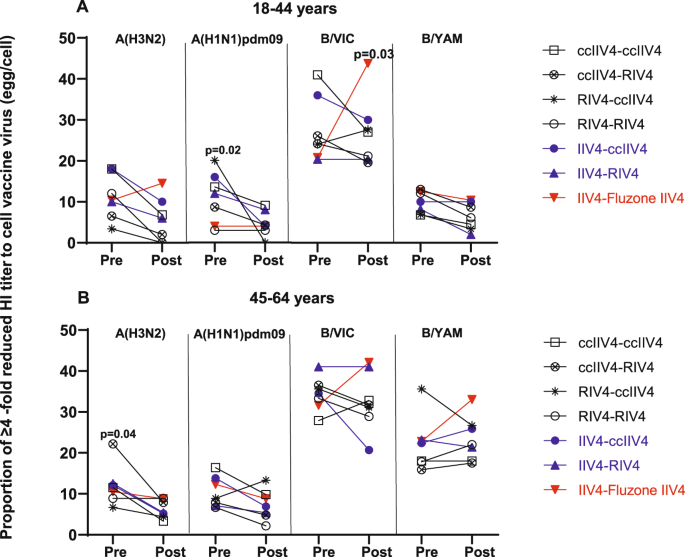
Proportions of Year 2 participants who had ≥4 -fold reduced titer to cell vaccine virus (egg/cell titer ratio) at pre- and 1-month post-vaccination were presented for each vaccine component among the seven Year 1-Year 2 vaccine arms. A: 18-44 years age group and B: 45−64 years age group. Fisher’s exact test (two-tailed) was performed for comparing proportions of ≥4 -fold reduced titer to cell vaccine virus between pre- and 1-month post-vaccination in each vaccine group. P values noted on the corresponding trend lines indicate statistically significant difference of the proportions between pre- and post-vaccination.
Total binding antibodies to HA head and HA stalk in year 2 were also analyzed (Fig. 8). At 1-month post-vaccination, the levels of total HA binding antibodies were similar in most repeat vaccination arms, except ccIIV4-RIV4 arm induced significantly higher (p < 0.05) HA head binding antibodies to A(H3N2), both ccIIV4-RIV4 and IIV4-RIV4 arms induced significantly higher (p < 0.05) HA head binding to B/Vic and B/Yam than the IIV4-IIV4 (Fluzone) arm (Fig. 8A). The total HA binding antibody GMT egg/cell ratio was around 1 against all 4 vaccine components with no significant difference between 7 repeat vaccination arms (Fig. 8B), indicating most of the total HA binding antibodies are not targeting the egg-adapted epitopes.
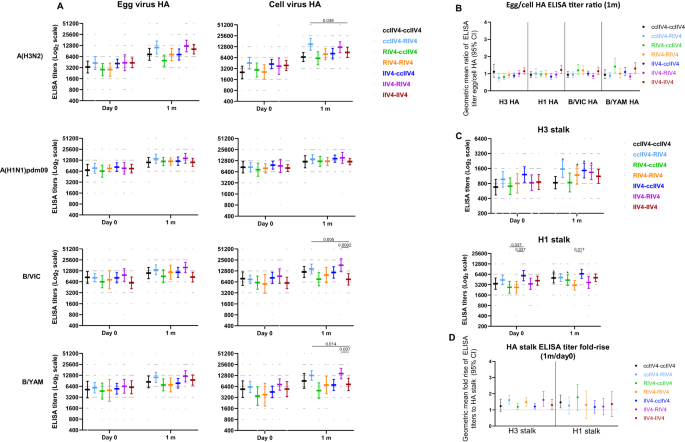
Antibody titers from each of the 7 vaccine arms were presented as geometric mean titers (GMTs) with 95% confidence interval (CI) for combined 18−44 years and 45−64 years age groups. Gray dots represented individual titers. ccIIV4-ccIIV4 (n = 20), ccIIV4-RIV4 (n = 22), RIV4-ccIIV4 (n = 16), RIV4-RIV4 (n = 16), IIV4-ccIIV4 (n = 22), IIV4-RIV4 (n = 22), IIV4-IIV4 (n = 22). A: HA head binding antibodies. B: Ratios of Egg/cell HA head binding antibody titers expressed as GM fold change with 95% CI. C: HA stalk binding antibodies for H3 and H1 stalk respectively. D: Fold-rise of HA stalk binding antibody titers from pre to 1 m post-vaccination expressed as GMFR with 95% CI. Unpaired t test (two-tailed) was used to compare the post-vaccination GMTs to cell virus HA between IIV4-IIV4 (Fluzone) arm and each of the remaining 6 vaccine arms within the same age group (A). One-way ANOVA corrected for multiple comparisons (Tukey’s test) was used to compare the GMTs of stalk binding antibody at each time point among the 4 vaccine groups (C). One-way ANOVA nonparametric Kruskal-Wallis test was used to compare the fold changes among the 4 vaccine groups (B, D). Statistically significant differences between groups are indicated by p values on the horizontal bars (A, C). *In (C), paired t test (two-tailed) was used for comparing the pre- and 1 m post-vaccination stalk antibody titers within the same vaccine group: significantly higher HA stalk antibody titers were detected in 1 m post-vaccination than pre-vaccination for H3 stalk antibody titers in ccIIV4-RIV4 (p = 0.0001), RIV4-RIV4 (p = 0.004), IIV4-ccIIV4 (p = 0.03), IIV4-RIV4 (p = 0.03); and for H1 stalk antibodies in ccIIV4-ccIIV4 (p = 0.008), RIV4-ccIIV4 (p = 0.006).
Comparing pre- and 1-month post-vaccination, A(H3N2) HA stalk binding antibodies were significantly boosted in ccIIV4-RIV4, RIV4-RIV4, IIV4-ccIIV4, and IIV4-RIV4 arms, while A(H1N1)pdm09 HA stalk binding antibodies were also significantly boosted in ccIIV4-ccIIV4 and RIV4-ccIIV4 arms (Fig. 8C). However, fold rise in both A(H1N1)pdm09 HA stalk and A(H3N2) HA stalk antibodies were low (GM fold rise <1.78) with no significant difference (p > 0.05) among all 7 repeat vaccination arms (Fig. 8D).

Rohit Malhotra is a medical expert and health journalist who offers evidence-based advice on fitness, nutrition, and mental well-being. His articles aim to help readers lead healthier lives.


