Chloroplast genome characteristics of W. arrhiza
The chloroplast genome of W. arrhiza is 169,602 bp in the quadripartite structure with one large single copy (LSC) region of 92,172 bp, one small single copy (SSC) region of 13,686 bp, and a pair of inverted repeat (IR) regions of 31,872 bp each (Fig. 2). The total guanine and cytosine (GC) content of the chloroplast genome is 35.78%. The relative occupation ratio of the LSC, SSC, and IR regions in the chloroplast genome were 33.63%, 30.79%, and 39.97%, respectively. It contains a total of 131 predicted genes, which are divided into three groups: 86 protein-coding genes (PCGs), 37 transfer RNA (tRNA) genes, and 8 ribosomal RNA (rRNA) genes. The entire set of genes exhibited a GC content of 38.52%. Within this, PCGs demonstrated a GC content of 37.08%, tRNA genes had a GC content of 52.50%, and rRNA genes exhibited a GC content of 54.69%. The LSC region contained a total of 83 genes, comprising 61 PCGs and 22 tRNA genes. In the SSC region, there were 11 genes, including 10 PCGs and one tRNA gene. The IR regions consisted of 36 genes, with seven PCGs, seven tRNA genes, and four rRNA genes duplicated (Table 1). Additionally, the rps12 gene is a trans-spliced gene that exons found in both the LSC and IRs, while the rps19 gene extended across two regions between the LSC and IRb.
The gene map of the chloroplast genome of Wolffia arrhiza. The map identifies three distinct regions: the large single copy region (LSC), the small single copy region (SSC), and the inverted repeat A/B regions (IRA/B). Additionally, the innermost dark gray track represents the GC contents. Genes on the inner side of the map are transcribed counterclockwise, while those on the outer side are transcribed clockwise.
According to the chloroplast genome annotation of W. arrhiza, 112 unique genes were categorized into four functional groups. There were 59 transcription and translation-related genes, 46 photosynthesis-related genes, five biosynthesis-related genes, and two genes whose functions were unidentified (Table 2).
Concurrently, a total of 17 unique intron genes were detected, and they were distributed across the LSC (11), IR (5), and SSC (1, ndhA) regions. It was comprised 11 PCGs and 6 tRNA genes. Among these, 15 genes (atpF, ndhA, ndhB, petB, rpl16, rpl2, rpoC1, rps12, rps16, trnA–UGC, trnG–UCC, trnI–GAU, trnK–UUU, trnL–UAA, trnV–UAC) had a single intron each, while the remaining 2 genes (clpP1, pafI) contained two introns each (Table 3).
Repeat sequences analysis
The web application Misa successfully identified a total of 48 Simple Sequence Repeats, SSRs, with lengths ranging from 10 to 16 bp. There was a total of 42 mononucleotide and 6 dinucleotide repeat types observed, all composed of A or T bases. There were 26 mononucleotides consisting solely of A and 16 mononucleotides consisting solely of T. Likewise, four dinucleotides comprised of AT repeats and two dinucleotides comprised of TA repeats. Among the identified SSRs, the LSC region contains the highest number, accounting for the majority (72.92%) with a total of 35 SSRs. The SSC region hosts seven SSRs (14.58%), while the IR region holds six SSRs (12.5%). At the same time, the Intergenic spacer (IGS) region presents the largest number of SSRs, totaling 40 (83.3%) of the total SSRs. Five SSRs (10.42%) were found in introns, and the remaining three SSRs (6.25%) were in PCG regions. Notably, each of the introns within the petB, rps16, trnK–UUU, pafI, and clpP1 genes contained one SSR. Moreover, SSRs within PCG were observed in one instance within the rpoB gene and one each in the ycf1 genes of IRa and IRb (Table 4).
A total of 32 long repeat sequences were detected using the REPuter web application. Among these repeats, there were 16 forward repeats (F), 1 reverse repeat (R), and 15 palindromic repeats (P). The lengths exhibited a distribution ranging from 30 to 69 bp, and among them, a unique palindromic repeat measuring 31,872 bp in length was identified. Out of these, 13 were exclusively located within the LSC region (40.63%), while 6 were uniquely situated in the IR region (18.75%). Additionally, 7 were suspended across both IRa and IRb (21.87%), with the remaining 6 spanning across the LSC and IR (18.75%), covering two structural regions. Furthermore, there were a total of 12 repeats solely present within a single PCG (37.5%), and all these repeats were located in the ycf2 gene. There was also one repeat that distributed across both the intron and the PCG (3.12%), and it was the longest repeat in terms of length. This was present across a total of 20 genes. One repeat was identified in both the IGS and the PCG (3.12%), and PCG corresponded to the pbf1 gene. There were three repeats spanning two PCGs (9.38%), and all these PCGs were identified as tRNA genes. In addition, six repeats were observed, spanning across introns and the IGS (18.75%), with four of them positioned in introns within the pafI gene, and the other two in the petB gene. The remaining nine repeats, containing the only reverse repeat that was detected, were exclusively located in the IGS (28.13%) (Table 5).
Codon usage
A total of 86 PCGs and their CDS were extracted from the chloroplast genome of W. arrhiza. These sequences have a combined length of 84,507 bp and consist of 28,169 codons. Leucine (Leu) was the most commonly encoded amino acid, comprising 10.50% of the total with 2959 codons. Conversely, Cysteine (Cys) was the least frequently encoded amino acid, making up only 1.10% of the total with 310 codons. The RSCU values for each codon fell within the range of 0.3 (CGG, Arg) to 2.01 (AGA, Arg). Out of a total of 30 codons with a high frequency of usage (RSCU > 1), except for UUG (Leu), 29 of these preferred synonymous codons ended with A or U(T) nucleotides. For the 32 codons with RSCU < 1, the 29 codons ended with C or G nucleotide, excluding CUA(Leu), AUA(Ile), and UGA(TER). Additionally, the terminator most preferred was UAA, showing an RSCU value of 1.60. In contrast, the codons AUG (Met) and UGG (Trp) demonstrated an RSCU value of 1, suggesting there is no bias as they each encode only one amino acid (Table S1).
Comparison of chloroplast genomes within Lemnoideae
The lengths of genes and IGS regions were compared among the chloroplast genomes of seven species of duckweed within the Lemnoideae subfamily (Fig. 3). The gene regions exhibited a range in length from 109,650 bp to 114,821 bp. Among the seven Lemnoideae species, W. arrhiza possessed the longest gene region with 114,821 bp (Fig. 3A). On the other hand, IGS regions had lengths that ranged from 51,306 bp to 59,471 bp, with W. arrhiza possessing the second shortest IGS region at 54,781 bp, following Lemna minor (Fig. 3B). The gene regions were further categorized into coding sequences (CDS) and intron regions. It was observed that CDS regions had a length range from 94,398 bp to 96,193 bp. Notably, W. arrhiza possessed the second-longest CDS region, measuring 96,189 bp, which was 4 bp shorter than W. globosa (Fig. 3C). Conversely, the lengths of intron regions ranged from 16,173 bp to 20,159 bp, with W. arrhiza having the longest intron region at 20,159 bp (Fig. 3D).
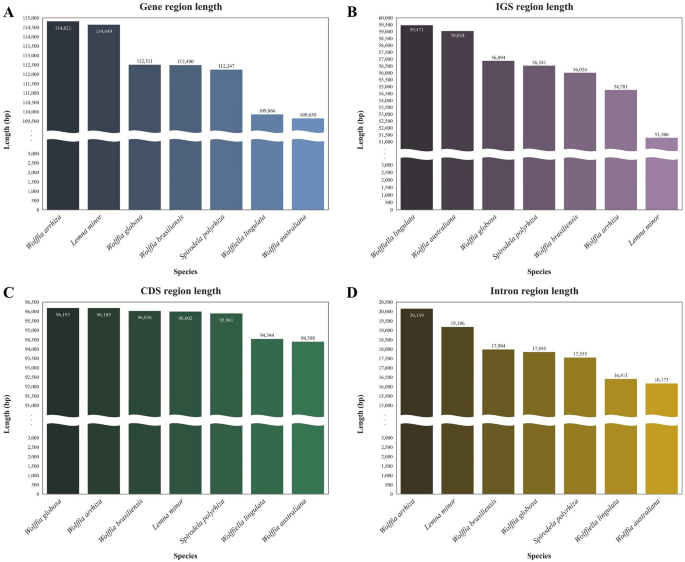
Length for each region of the Lemnoideae, including Wolffia arrhiza. (A) Gene region length (B) IGS region length (C) CDS region length (D) Intron region length. The X-axis represents the species names, while the Y-axis depicts the lengths of the regions. The arrangement of each graph is based on the ascending order of region lengths.
To gain further insight into these changes, an analysis was conducted on events such as insertions, deletions, duplications, and intron changes in genes across Lemnoideae species (Table S2). Compared to other Lemnoideae species, W. arrhiza was represented by the genes pafI, pafII, clpP1, and pbfI, which are synonymous with the ycf3, ycf4, clpP, and psbN genes in other species. When comparing other genes, the most significant alterations were the deletion events of pseudogenes ycf68 and ycf15 in the IR region (Fig. 4). Upon a more detailed examination, it was observed that the gene ycf68, which had perfect overlap with trnI–GAU in other species, was deleted in W. arrhiza, leaving only trnI–GAU. However, another deleted gene, ycf15, which has been alone in other species, underwent deletion in W. arrhiza and sequences remained at an IGS region. The length between ycf2 and trnL–CAA flanking ycf15 in W. australiana, Wolffiella lingulata, Lemna minor, and Spirodela polyrhiza were 1005 bp, 1019 bp, 1027 bp, and 1027 bp, respectively. In W. arrhiza, W. globosa, and W. brasiliensis, where ycf15 was deleted, the IGS length between ycf2 and trnL–CAA was 988 bp, 993 bp, and 1023 bp, respectively.
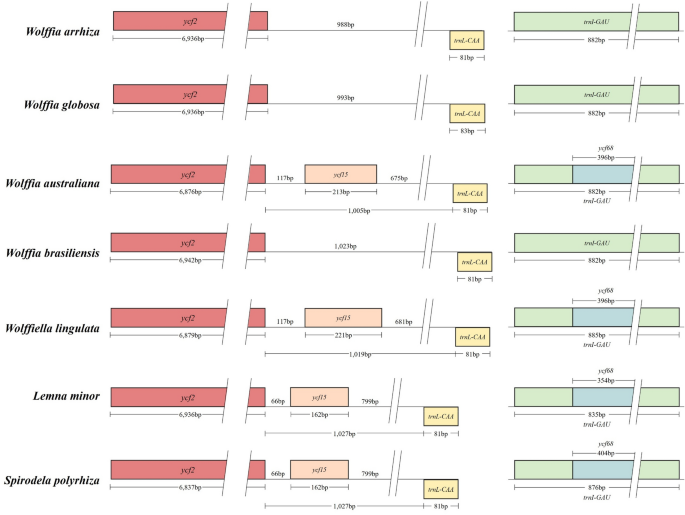
Comparative analysis of alterations resulting from the ycf68, and ycf15 deletion in Wolffia arrhiza. This represents one of the IR regions, and the other IR region exhibits a same aspect with reverse complementarity. The squares represent genes, where those transcribed on the forward strand are positioned at the top of the line, and those transcribed on the reverse strand are located at the bottom of the line. The numbers adjacent to the squares represent the lengths of individual genes, while the numbers above the lines are the lengths of IGS between each gene. ycf2 is depicted by the color red, ycf15 by orange, trnL–CAA by yellow, trnI–GAU by green, and ycf68 by blue.
To identify variations in introns, the gap between the longest and shortest length values for each species within the same gene was calculated (Table S2). As a result, it was determined that the lengths of the petB and rpl16 genes in W. arrhiza are 1400 bp and 1983 bp, respectively. These lengths exceed twice the sizes observed in other species, where they typically range from 642 to 701 bp for petB and 411 bp (the exception of Lemna minor, which has a length of 1714 bp) for rpl16. When analyzing the exons and introns of these genes in each species, the exons exhibit consistent lengths across all species (ranging from 642 to 654 bp for petB and 408–411 bp for rpl16). However, in W. arrhiza, the introns are notably longer, with the petB gene containing a 752 bp intron and the rpl16 gene containing a 1575 bp intron (Table S3).
Sequence homology among the chloroplast genomes of seven species within the Lemnoideae subfamily was assessed and visualized via the shuffle-LAGAN mode in mVista. The annotation data relied upon the reference strain, W. australiana (strain 8730). As a result, it was established that the chloroplast genome sequence of duckweed maintains a high degree of sequence conservation, with very few regions exhibiting sequence identity below 90% (Fig. 5). In detail, the IR region showed a higher level of preservation when contrasted with the LSC and SSC regions. In addition, the mutation rate was greater in the IGS region in contrast to the PCG region. The majority of PCGs were generally well-preserved, but significant variations were observed in some PCGs, including matK, rpoC2, ndhF, cssA, ndhD, and ndhH. In contrast to the PCG regions, the non-coding regions showed a relatively higher mutation rate in numerous locations. Within non-coding regions, intergenic regions displayed the highest variability rate. Upon visual examination of the figure, the most notable segments appeared to be trnC(GCA)-petN, petN–psbM, and trnE(UUC)-trnT(GGU).
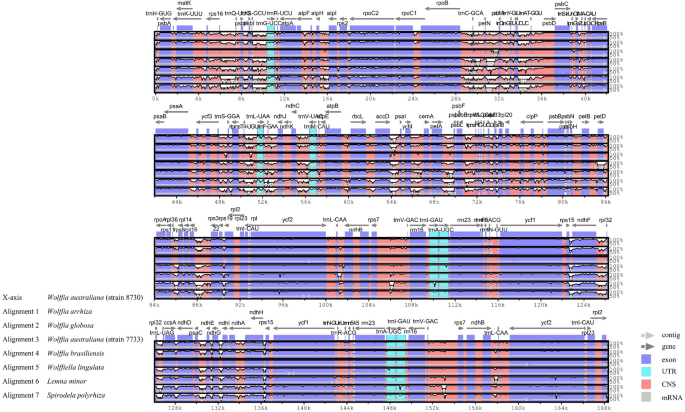
Analyzed the chloroplast genome sequences of seven Lemnoideae species, including Wolffia arrhiza, using mVista, with Wolffia australiana as the reference. The X-axis represents the coordinates of the chloroplast genome sequence position, while the Y-axis indicates the range of sequence identity from 50 to 100%. The direction and position of the genes are depicted by the gray arrows on the graph. The graph’s shaded colors have the following meanings: the dark blue regions correspond to protein coding sequences (CDS), the pink regions represent Conserved Non-Coding Sequences (CNS), and the light-blue regions indicate UTRs.
To clearly identify the variable regions within the mVista results, a sliding window analysis was executed using DnaSP v.6.10 software, followed by the calculation of nucleotide diversity values (π, Pi). There were 769 nucleotide diversity point observed, with values ranging from 0.00000 to 0.21294, and an average value of 0.04589 (Fig. 6). The nucleotide diversity value was highest (0.21294) in the LSC region, while the IR region had the lowest value (0.00048), excluding zero. In this regard, the IR region exhibited significantly lower variability compared to the LSC and SSC regions. Among them, 12 locations demonstrated high Pi values greater than 0.15. Eight of them were found in the LSC region, while four were located in the SSC region. Within the LSC region, 5 locations were detected in intergenic regions including rps16–trnQ(UUG), trnS(GCU)-trnG(UCC), atpH–atpI, petA–psbJ, psbE–petL, while 3 locations were found in the coding regions of trnC(GCA), trnT(GGU), and trnT(UGU). In the SSC region, one of the four positions was located in the intergenic region of ndhF–rpl32, whereas the other three were found in the coding regions of ndhF, rpl32, and ndhE. The coding region and non-coding region with the highest nucleotide diversity values were trnT(GGU) (0.18841) and trnS(GCU)-trnG(UCC) (0.21294), respectively, located in the LSC.
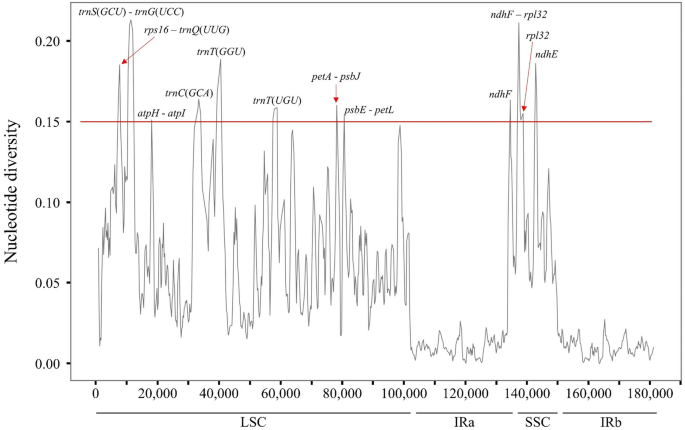
Nucleotide diversity of chloroplast genome sequences in Lemnoideae, including Wolffia arrhiza. The X-axis represents the alignment sequence’s position, while the Y-axis indicates the values for nucleotide diversity. The use of a hyphen to connect two genes signifies a non-coding region, whereas the representation of a single gene indicates a coding region.
To delve deeper into the nucleotide diversity results, SNPs and InDels were analyzed in seven Lemnoideae species, utilizing Wolffia australiana as a reference. This revealed 17,269 SNPs and 2030 InDels. The majority of SNPs appeared in the IGS regions (51.91%), followed by exon regions (35.20%) and intron regions (12.89%) (Table S6). These findings aligned with earlier results (Fig. 6), particularly noting that the IGS in trnS(GCU)—trnG(UCC) represented 5.30% of the total IGS region, and the IGS in ndhF—rpl32 comprised 4.03% of the total IGS region. Additionally, InDels were predominantly distributed in IGS regions (76.35%), with lesser occurrences in intron (17.10%) and exon regions (6.55%) (Table S7). Most were short InDels of 10 base pairs or fewer, accounting for 80.59% of the total, and one long InDel of 1000 bp was detected. Similarly with SNPs aspect, the IGS regions in trnS(GCU)—trnG(UCC), and ndhF—rpl32, constituted 4.54% and 1.86% of the total IGS region, respectively.
The gene distribution at the boundaries of the LSC/SSC and IR regions in the chloroplast genomes of the seven species was compared using IRscope. Overall, the distribution of genes at each boundary region appeared to be similar, with rpl22, rps19, rpl2, rps15, ndhF, ndhH, trnH, and psbA. However, it was observed that the rpl2 gene is found solely in the IRb region and is absent in the IRa region of W. australiana and Wolffiella lingulata (Fig. 7, Table S5). Although not shown in the figure due to their location at the boundaries and greater distance, other genes did not undergo any loss. Nevertheless, variations were noted in the association between genes and the boundary lines. The JLB (LSC/IRB) boundary displayed three different configurations: positioned within the rps19 gene, within the rpl2 gene, or within IGS between the rps19 and rpl2 genes. For W. arrhiza, the JLB boundary can be found within the rps19 gene. The rps19 gene spans 240 bp in the LSC region, and the remaining 39 bp extend into the IRB region. Similar cases are apparent in the W. australiana, W. brasiliensis, and Wolffiella lingulata. These species have respectively occupied 277 bp, 249 bp, and 250 bp within the LSC region, along with extensions of 2 bp, 30 bp, and 29 bp into the IRB. In the case of Lemna minor, it was observed that the boundary of the JLB was located within the rpl2 gene. The rpl2 gene spanned 1100 bp within the IRB region, with the remaining 386 bp extending towards the LSC region. W. globosa and Spirodela polyrhiza were both found to have the JLB boundary positioned within the IGS between the rps19 and rpl2 genes. Additionally, the rps19 and rpl2 genes were identified within the LSC and IRB regions, respectively. In the instance of the JSA (SSC/IRA) boundary, it presented in two different cases, with one found within the ndhH gene and the other within the IGS region lying between the ndhH and rps15 genes. For W. arrhiza, the ndhH and rps15 genes were contained within their respective SSC and IRA regions, rather than extending beyond them. This same pattern was also observed in W. globosa, W. australiana, W. brasiliensis, and Spirodela polyrhiza. Nevertheless, for Wolffiella lingulata and Lemna minor, the boundary of the JSA was positioned within the ndhH gene, with each extension 1183 bp and 1144 bp into the SSC region, while the remaining 5 bp and 44 bp entered the IRA region.
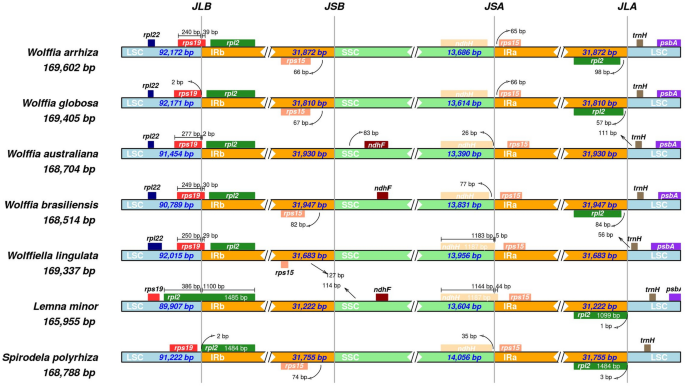
Comparing the boundaries of chloroplast genome regions in seven species, including Wolffia arrhiza, from the Lemnoideae subfamily: LSC, IRs, and SSC. The junctions between each pair of genomic regions are indicated as JLB (LSC/IRB), JSB (SSC/IRB), JSA (SSC/IRA), and JLA (LSC/IRA). Genes transcribed on the forward strand are depicted above the line, whereas genes transcribed on the reverse strand are exhibited below the line. Furthermore, the numbers above the genes signify the gap between the gene’s start or end and the region’s boundary.
Phylogenetic analysis
To explore the phylogenetic relationship of W. arrhiza, a phylogenetic tree was created that included a total of 15 species. This species set comprised 7 species from the Lemnoideae subfamily, which includes W. arrhiza, and 7 species within the Araceae family to which Lemnoideae subfamily belongs, along with one outgroup species, Zea mays. Excluding genes in the IR, there are 44 PCGs shared between them (Table S4). In addition, based on the results from Prottest, the CpREV + G + I model was determined to be the best fit model for explaining protein evolution across the 15 species. The Bayesian analysis was performed using BEAST v1.10.4 software, employing 50,000,000 Markov Chain Monte Carlo (MCMC) chains with the previously identified shared PCG and the most suitable model. Consequently, the phylogenetic tree was constructed, with Bayesian posterior probability values that ranged from 0.5643 to 1 (Fig. 8). The tree can be divided into three parts: W. arrhiza—Spirodela polyrhiza, Colocasia esculenta—Symplocarpus renifolius, and the outgroup. W. arrhiza is classified as part of the W. arrhiza—Spirodela polyrhiza section, belonging to the Lemnoideae subfamily. It exhibits the nearest evolutionary relationship with W. globosa.
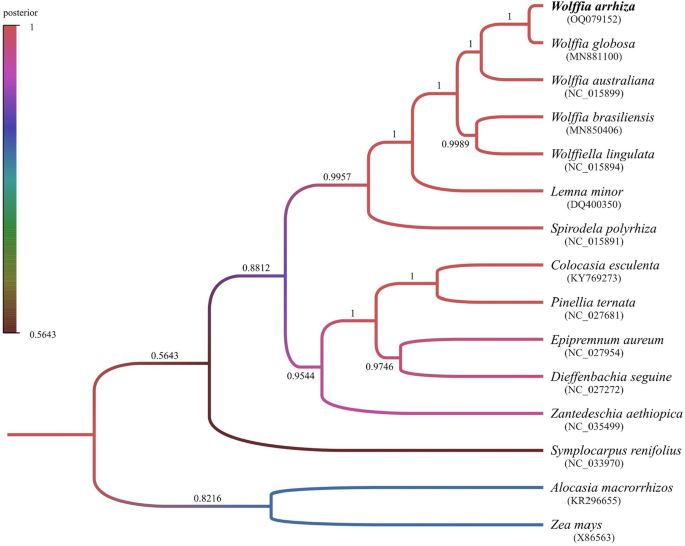
Bayesian phylogenetic tree of Araceae species based on the chloroplast genome data. The colors of the branches in the tree represent the Bayesian posterior probability, as indicated by the color bar. The numerical values displayed on the branches represent precise posterior values. At the bottom of each species name is the genbank accession number.

Shambhu Kumar is a science communicator, making complex scientific topics accessible to all. His articles explore breakthroughs in various scientific disciplines, from space exploration to cutting-edge research.


